We had a slight delay yesterday evening. Near Lulworth Cove on the Dorset coast a scuba diver didn’t return to the surface with his dive companion. He couldn’t be found and was reported missing shortly after.
Today’s blog is by Mark Stinchcombe from the National Oceanography Centre at Southampton and is about nutrients.
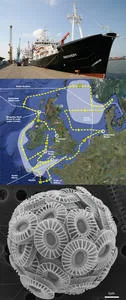
We had just left the area but turned around to help with the search effort. It is perhaps just as well that we did: after 2 hours of searching, as it was starting to seem unlikely that the diver could still be alive, Mark Squibb, one of the RRS Discovery crew, spotted the diver stranded at the base of some cliffs. The information was conveyed to the coastguard and the diver was rescued and we believe is fine. He had been carried away from the dive site by strong tidal currents. After that we continued on our way eastwards towards the entrance to the North Sea.
Phytoplankton require more than just light to grow. They require nutrients as well. Think about your own garden. You plant out your tomato plants in a nice sunny spot and water them daily but you need to have planted them in a nutrient rich soil as well, such as compost you would buy from the shop, or you feed them with a liquid fertiliser for them to really grow and give you the fruit you are after. Phytoplankton require nutrients in much the same way. Darren talked about the carbon and nitrogen cycle a few days ago and mentioned how phytoplankton can bloom under certain conditions. There are many nutrients required by phytoplankton, not just nitrogen. I am measuring what are known as the “macro-nutrients”, in this case nitrate, phosphate and silicate. I measure them in the water samples brought up in the CTD as well as in the bioassays.
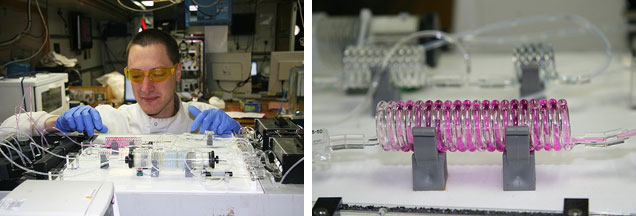
To do this I use an instrument called a Segmented Flow Autoanalyser connected to an autosampler. The autoanalyser is a pump which draws the water sample into a three narrow glass tubes, one for each nutrient. At various points along the tube different chemicals (called reagents) are added and mixed by passing the solution around coils. Further mixing is encouraged by bubbles which are injected at exact intervals. Just in front of the bubble turbulence helps to mix reagents and samples. The bubbles also help to separate one sample from the other. These bubbles form the ‘segmented’ part of the name. The reactions taking place produce a colour and the amount of colour formed is directly linked to the amount of the nutrient in the water. The intensity of this colour can then be measured using an instrument called a spectrophotometer. In this, light from a small bulb is passed through the sample and the amount of light to reach the detector at the other side is measured. The more of the nutrient there is in the water the darker the colour will be in the solution and so the less light will pass through it.
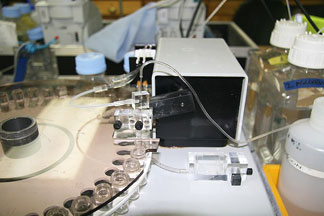
An autosampler consists of a rosette wheel in which samples can be placed. Every three minutes the wheel turns a notch, the next sample comes into place, a hollow needle dips into the sample and sucks out the seawater into the tubes leading to the coils. This allows me to process many samples automatically in a relatively short amount of time. It also means I can provide data for nitrate, phosphate and silicate within a few hours of the sample being taken.
Nitrate and phosphate are used by all phytoplankton species and without them they just wouldn’t grow. Silicate is used by a select few, namely the diatoms. Within the water column the presence or absence of any of these nutrients can be suggestive of what is going on in the water. For example, surface water without any nitrate or phosphate but with an abundance of silicate could indicate a recent bloom event by a species other than diatoms, but an absence of silicate as well could indicate the bloom was indeed a diatom bloom. Though these numbers only hint at what is going on, other measurements, such as the microscope observations by Jeremy (mentioned in an earlier blog) can provide the overall picture.
Within the bioassay it is also very important that we are considering every possible variable that might be affecting the bottles. We want to be sure that if there is any pattern with the different levels of CO2 treatment that we can be confident that it is the CO2 level that is causing the change rather than anything else. So again measuring the nutrient concentration is very important. If the population in the bottle has died off, or proliferated, is this because it is hindered or indeed helped by the CO2 level or is it because there are no nutrients or an abundance of nutrients? Because we measure the nutrient level at the start, after 48 hours and after 96 hours we can track what happens to them and again compare them with other data to try to piece together what is happening.
This is the first time I have been involved in an experiment on this scale, where all the scientists on the ship are playing equally important roles in regard to the bioassays and everyone has something to bring to the final story. This is making it extremely interesting scientifically but also very exciting personally as every day the plot thickens like a good novel, and more often than not we end up with more questions than answers. Only when we have done all the experiments and have all the data analysed will the full story be revealed.