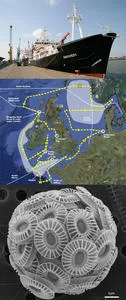
This morning we reached the most easterly point of the cruise, and carried out a CTD sampling station in the Skaggerak, nestled between Denmark, Norway, and Sweden (red dot on map).
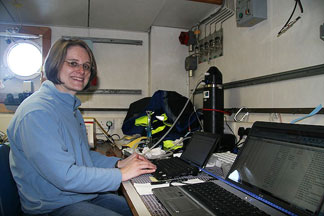
Today’s blog is by Evelyn Lawrenz, also from the University of Essex, describing her work to find out how ocean acidification affects the physiology of phytoplankton and their ability to take up CO2 through photosynthesis.
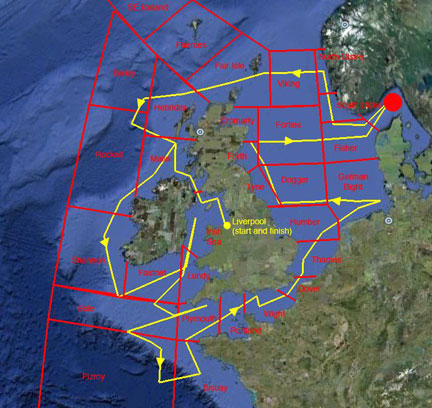
For the first time on this cruise we have passed outside the weather forecast areas (7 June blog) altogether, and are now east of South Utsire and Fisher. We will steam back to the west over the course of the day, trying to get away from some bad weather predicted for south of Norway.
Phytoplankton are microscopic algae and, like their terrestrial counterparts, the plants, they have pigments to absorb sunlight which they use as an energy source to take up carbon dioxide (CO2) and convert it to carbohydrates through photosynthesis. Phytoplankton are consumed by larger organisms, fuelling marine food webs from shallow coastal waters to the open ocean and from the surface to the deep sea. In fact, take away the phytoplankton and the oceans would be devoid of fish, crabs, mussels, dolphins... you name it!
To understand how phytoplankton respond to environmental change, we need to measure both how rapidly they are photosynthesising (at the light level they are experiencing) and also their maximum potential rate of photosynthesis (the rate they could achieve under optimal light). The latter is connected with their “physiological health”. For instance, if they are starved of nutrients then they may struggle to manufacture pigments and for that reason not be able to photosynthesise rapidly, regardless of light intensity. You can think of “physiological health” as a kind of ‘happiness index’, which tells us how well the phytoplankton are coping with the prevailing environmental conditions.
Measurements of physiology and photosynthesis often require incubation of samples in a laboratory setup and/or radioactive tracers, as described by Laura in yesterday’s blog. For that reason they are not routinely made as part of oceanographic studies. And, because the techniques are labour-intensive, even when they are used only a few data points are generated per day. Thus, relatively little information exists on global patterns in photosynthesis, which is problematic when we are trying to assess the impact of global change on phytoplankton.
To overcome this data shortage, scientists at the University of Essex have led advances in measuring physiology and primary productivity by ‘fluorometry’. This takes advantage of the fact that the major algal pigment, chlorophyll, emits red light upon illumination with blue light. This red fluorescence can then be used to measure physiological parameters and photosynthesis rates. This relatively new technique allows measurements to be made rapidly and automatically, thereby providing data almost immediately, and lots of it. Depending on the kind of measurement, the whole process takes only a few minutes, 30 minutes at most. This is a huge leap towards providing better coverage of physiological information with high resolution in space and time, and across vast areas of the ocean.
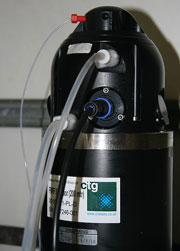
The instruments we are using on this cruise are two Fast Repetition Rate Fluorometers (FRRF). One is attached to a pipe that pumps seawater continuously from below the ship while it is moving, thereby providing a continuous stream of data along the entire cruise track. This will help us to discern patterns in physiology, for instance as we travel from shallow coastal waters to open ocean areas, which differ greatly in the phytoplankton species present and in their CO2 concentrations.
With a second fluorometer we are measuring the samples collected with the CTD and those coming from the CO2-enrichment experiments. All these data will contribute to a better understanding of how ocean acidification may alter photosynthetic rates and act to the benefit of some species but the detriment of others.