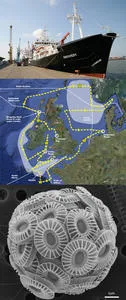
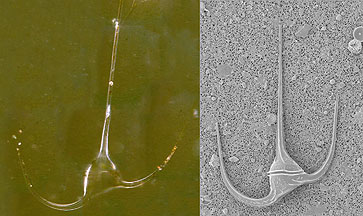
On the cruise so far we have already seen large differences in the dominant phytoplankton present in different places. In just the last three days we have seen some places where diatoms dominated, others where coccolithophores dominated, and another where dinoflagellates were the most numerous group (see photograph of a rather beautiful dinoflagellate).
One of the subjects we are very interested in is whether ocean acidification will help some of these phytoplankton groups and hinder others. If so then there are likely to be ramifications, both for food webs (for instance, jellyfish presumably thrive on some diets at the expense of fish) and for climate (for instance coccolithophores are high DMS producers – the meaning and significance of DMS will be explained in a couple of day’s time).
Therefore an important objective for our work is to be able to measure accurately the plankton biodiversity, or in other words the set of plankton species present and how many of each of them there are in 1 litre of seawater. We measure this both at the CTD stations, and also in the bioassays, looking with special attention at whether the biodiversity changes in the higher CO2 bioassays. In this and the next blog entry we will describe some of the techniques we are using to do this.
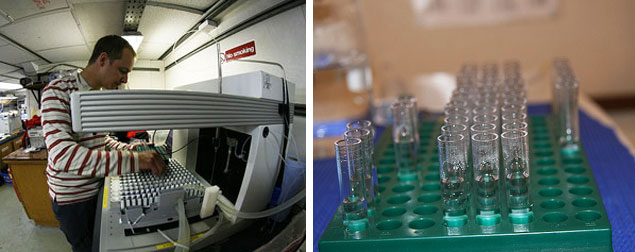
Ross Holland, also from the National Oceanography Centre Southampton, runs a highly-sophisticated instrument called a flow cytometer (photo). This was originally developed for medical science, and was used to rapidly count different particles in the blood stream, and then later transferred across to be used in oceanography. Flow cytometers are impressive in a number of ways. To start with:
- they can count extremely small particles (sizes between 0.2 and 50 microns, where a micron is a thousandth of a millimetre),
- they can do so extremely rapidly, in just a few seconds for each analysis, and
- they only need a very small amount of water, typically about 0.5 millilitres (just one tenth of a teaspoon).
Flow cytometers are extremely useful for counting the abundance of the very smallest components of the plankton. For instance, we are using flow cytometry to tell us how numerous the viruses, bacteria, protists and smaller phytoplankton are.