The Earth is warming and global mean temperature is predicted to increase (IPCC, 2007). The implications for human well-being, biodiversity, sea level rise and habitability of coastal zones are profound.
The ability of society to prepare for climate change depends on climate model predictions. Accurate knowledge of the earth’s surface temperature, particularly over the recent ca. 150 years, is needed to provide confidence in those predictions. One important metric of climate change is global surface temperature, and sea surface temperature (SST) is its ocean component. However the historical SST record is subject to many sources of uncertainty.
Observations of in situ SST come from many different types of platform and instrument (Kent et al., 2010). The earliest observations in the International Comprehensive Ocean-Atmosphere Data Set (ICOADS, Woodruff et al., 2011) were made aboard sailing ships. Steam ships began operating long-distance routes from about 1870, and sail and hybrid sail/steam ships were in use until the early 20th century. The typical size and speed of ships has increased over time and varies regionally. The mix of vessel types changed abruptly during World War II (WW2, Rayner et al., 2003; Thompson et al., 2008). From the late 1970s, moored and drifting buoys provide SST observations and the latter now numerically dominate the SST record. The importance of the measurements for safety, science and commerce has been long recognised, with standardized observing practices dating back over 150 years (Maury, 1954).
Early SST measurements required water samples to be collected in buckets and the method is still in use, only becoming less common as ships became too large and fast. The earliest buckets were made of wood, but these were valuable and easily damaged so canvas buckets became common. It was later realised that canvas buckets cooled significantly between sampling and measurement (e.g., Ashford, 1948) and a transition to insulated buckets of various designs began after WW2. In addition to changes in buckets, there is an ongoing transition to measurements using engine-room cooling water intakes (ERI). Early ERI measurements, like the buckets, used mercury thermometers but electrical thermometers later became the norm. Subsequent technology developments allowed remote-reading and data telemetry, installation of ERI thermometers closer to the water inlet, and the use of dedicated "hull sensors". The same technology enabled arrays of moored and drifting buoys, now essential components of the SST observing system. In short, the SST observing system has constantly evolved, necessitating painstaking research to minimize observing system artefacts in the centennial climate record.

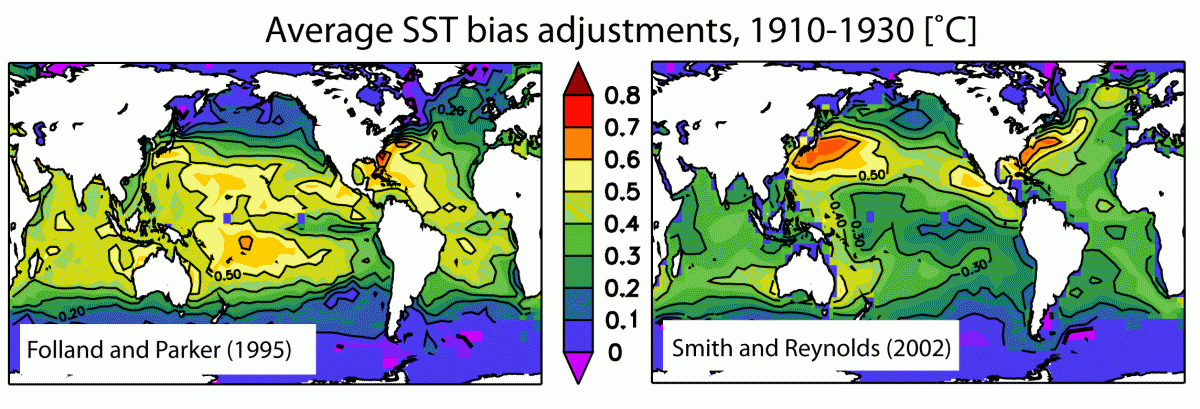
Historical measurements of SST therefore require adjustment for observational biases that vary in time and space. The literature provides information on observing instrumentation, practice and the expected resultant biases (Kent et al., 2010; Kent and Taylor, 2006; Kennedy et al., 2011; Folland and Parker, 1995). However the information on observation methods and environmental conditions required to estimate bias is usually unknown, especially in the early period. Biases have therefore been estimated and corrected based on the large space- and time-scale characteristics of gridded analyses of the SST observations themselves and require for their calibration observations of night-time marine air temperature which are also uncertain (Rayner et al., 2013). The result is that there are major differences between the bias adjustment fields used to date, which limits our confidence in global and regional estimates of historical SST. It is recognised that a lack of independent estimates of bias is a significant weakness of historical SST analysis (Kennedy et al., 2011).
The HOSTACE approach is to try to make adjustments to the SST observations that will vary between methods, and can vary from ship-to-ship and buoy-to-buoy. The steps required are:
- clustering the observations made by each individual platform (ship or buoy) using ID information where available or voyage tracking for observations with no platform ID
- deriving models of the expected functional dependence of SST biases, for example heat exchange from different types and sizes of buckets or offsets for individual buoys or ERI installations
- identifying the real ‘expected’ variability of SST using high-quality data from the satellite-era as a reference, particularly data from the ARC project. For example the expected variability may depend on time of day, measurement depth, wind or other environmental parameters.
- comparing differences between the observed and expected SST with the functional dependence predicted by the bias models and diagnosing the measurement method and level of confidence in the assignment
- adjusting the SST observations accounting for the uncertainty in all of the previous steps
- comparing the adjusted observations with independent observations from island and coastal stations and with surface measurements from hydrographic casts
The adjusted observations will be used to create a gridded dataset for the global ice-free oceans using a multi-scale analysis combining global and local estimation. Global estimation (Ishii et al., 2005; Kaplan et al., 1997; Rayner et al., 2003; Smith and Reynolds, 2004) captures the large-scale features of the field well, even for sparse data, but does not resolve the finer details important for regional climate studies. In contrast, local estimation (Berry and Kent, 2009; Reynolds and Smith, 1994) resolves the finer details (when data are present) but struggles to fill in large gaps. Recently researchers have combined global and local estimation (Karspeck et al., 2011; Rayner et al., 2008) and we will develop and adapt their methods for our dataset. The representativeness of the HOSTACE gridded dataset will be verified, including using long time series of land-based climate indices such as the North Atlantic Oscillation and El Niño Southern Oscillation.
The HOSTACE dataset will be suitable for many applications, including analysis of global and regional SST variability, forcing of atmospheric reanalyses, ocean data assimilation, and assessment of climate models and palaeo-temperature proxies. As part of HOSTACE we use the dataset to improve our understanding of centennial change with a detection and attribution case study of early 20th-century warming to try to quantify the contributions from greenhouse gas forcing, natural forcing, and internal variability which currently vary substantially between estimates (Delworth and Knutson, 2000; Hegerl et al., 2007).
We also plan to work with other dataset development scientists to try to understand the causes of differences between the available datasets and hence characterise the structural uncertainty (Thorne et al., 2005) in SST analyses.
References
Ashford (1948) A new bucket for measurement of sea surface temperature. QJ https://onlinelibrary.wiley.com/doi/10.1002/qj.49707431916/abstract
Berry and Kent (2009) A new air – sea interaction gridded data set from ICOADS with uncertainty estimates. BAMS. https://doi.org/10.1175/2008BAMS2639.1
Delworth and Knutson (2000) Simulation of early C20th global warming. Science. https://www.sciencemag.org/content/287/5461/2246.abstract
Folland and Parker (1995) Correction of Instrumental Biases in Historical SST Data, QJ. https://onlinelibrary.wiley.com/doi/10.1002/qj.49712152206/full
Hegerl et al. (2007) Detection of human influence on a new 1500yr climate reconstruction, JClim. https://doi.org/10.1175/JCLI4011.1
IPCC (2007) Summary for Policymakers. https://www.ipcc.ch/publications_and_data/ar4/wg1/en/contents.html
Ishii et al (2005) Objective analyses of SST and marine met. variables for the C20th using ICOADS and KOBE. IJoC. https://onlinelibrary.wiley.com/doi/10.1002/joc.1169/pdf
Kaplan et al. (1997) Reduced space optimal analysis for historical data sets: 136 years of Atlantic SSTs. JGR. https://onlinelibrary.wiley.com/doi/10.1029/97JC01734/abstract
Karspeck et al. (2011) Bayesian modelling and ensemble reconstruction of mid-scale variability in N. Atlantic SSTs for 1850–2008. QJ. https://onlinelibrary.wiley.com/doi/10.1002/qj.900/abstract
Kent and Taylor (2006) Toward Estimating Climatic Trends in SST, Part 1: Methods of Measurement, JTech. https://journals.ametsoc.org/doi/abs/10.1175/JTECH1843.1
Kent et al. (2010) Effects of instrumentation changes on ocean surface temperature measured in situ. WIRES: CC.
Kennedy et al. (2011) Reassessing biases and other uncertainties in SST observations since 1850 Part 2: biases and homogenisation, JGR. https://www.metoffice.gov.uk/hadobs/hadsst3
Maury (1854) Explanations and Sailing Directions to Accompany the Wind and Current Charts. 6th ed. U.S. Navy.
Rayner et al. (2003) Global Analyses of SST, Sea Ice and Night Marine Air Temperature Since the Late C19th, JGR. https://onlinelibrary.wiley.com/doi/10.1029/2002JD002670/abstract
Rayner et al. (2008) Testing the HadISST2 Analysis in an Ideal World, CLIMAR3. https://icoads.noaa.gov/climar3/c3poster-pdfs/S3P1-Rayner.pdf
Reynolds and Smith (1994) Improved global SST analyses using optimum interpolation. J.Clim. https://doi.org/10.1175/1520-0442(1994)007<0929:IGSSTA>2.0.CO;2
Smith and Reynolds (2002) Bias corrections for historical SSTs based on marine air temperatures. J.Clim. https://doi.org/10.1175/1520-0442(2002)015<0073:BCFHSS>2.0.CO;2
Smith and Reynolds (2003) Extended Reconstruction of Global SST Based on COADS Data (1854–1997). J.Clim. https://www.ncdc.noaa.gov/ersst
Smith and Reynolds (2004) Improved Extended Reconstruction of SST (1854–1997). J.Clim. https://www.ncdc.noaa.gov/ersst
Smith et al. (2008) Improvements to NOAA’s Historical Merged Land-Ocean Surface Temperature Analysis (1880-2006), J.Clim. https://www.ncdc.noaa.gov/ersst
Thompson et al. (2008) A large discontinuity in the mid-20th century in observed global-mean surface temperature, Nature. https://www.nature.com/nature/journal/v453/n7195/abs/nature06982.html
Thorne et al. (2005) Uncertainties in Climate Trends: Lessons from Upper-Air Temperature Records. BAMS. https://doi.org/10.1175/BAMS-86-10-1437
Woodruff et al. (2011) ICOADS Release 2.5 and Data characteristics, IJoC. https://onlinelibrary.wiley.com/doi/10.1002/joc.2103/abstract
Former NOC people
Dr David Berry

Giulia Carella

Jonathan Harrison

University of Reading
Prof. Chris Merchant

Dr Simone Morak

Thomas Hall

University of Edinburgh
Prof. Gabriele Hegerl

To appear
Elizabeth C Kent, Nick A Rayner, David I Berry, Ryan Eastman, Victoria Grigorieva, Boyin Huang, John J Kennedy, Shawn R Smith and Kate M Willett, Observing requirements for long-term climate records at the ocean surface, accepted Frontiers in Marine Science, OceanObs19 Special Issue.
Published 2019
Chan, D., Kent, E.C., Berry, D.I., Huybers, P. (2019) Correcting datasets leads to more homogeneous early 20th century sea surface warming, Nature, 571, 393–397. https://doi.org/10.1038/s41586-019-1349-2.
Davis, L.B.B., Thompson, D.W.J., Kennedy J.J., Kent, E.C. (2019) The importance of unresolved biases in 20th century sea-surface temperature observations, BAMS, 100, 621–629. https://doi.org/10.1175/BAMS-D-18-0104.1.
Published 2018
Carella, G., Kennedy, J.J., Berry, D.I., Hirahara, S., Merchant, C.J., Morak-Bozzo, S., Kent, E.C. (2018) Estimating sea surface temperature measurement methods using characteristic differences in the diurnal cycle. Geophysical Research Letters, 45. 363–371. https://doi.org/10.1002/2017GL076475
Thorne, P.W., Allan, R.J., Ashcroft, L., Brohan, P., Dunn, R.J.H., Menne, M.J., Pearce, P., Picas, J., Willett, K.M., Benoy, M., Bronnimann, S., Canziani, P.O.., Coll, J., Crouthamel, R., Compo, G.P., Cuppett, D., Curley, M., Duffy, C., Gillespie, I., Guijarro, J., Jourdain, S., Kent, E.C., Kubota, H., Legg, T.P., Li, Q., Matsumoto, J., Murphy, C., Rayner, N.A., Rennie, J.J., Rustemeier, E., Slivinski, L., Slonosky, V., Squintu, A., Tinz, B., Valente, M.A., Walsh, S., Wang, X.L., Westcott, N., Wood, K., Woodruff, S.D., Worley, S.J. (2018) Toward an integrated set of surface meteorological observations for climate science and applications, BAMS, 98, 2689–2702. htttps://doi.org/10.1175/BAMS-D-16-0165.1
Published 2017
Kent, E.C., Kennedy, J.J., Smith, T.M., Hirahara, S., Huang, B., Kaplan, A., Parker, D.E., Atkinson, C.P., Berry, D.I., Carella, G., Fukuda, Y., Ishii, M., Jones, P.D., Lindgren, F., Merchant, C.J.,Morak-Bozzo, S., Rayner, N.A., Venema, V., Yasui, S., Zhang, H.-M. (2017) A call for new approaches to quantifying biases in observations of sea-surface temperature, BAMS, 8, 1601–1616. https://doi.org/10.1175/BAMS-D-15-00251.1
Carella, G., Morris, A.K.R., Pascal, R.W., Yelland, M.J., Berry, D.I., Morak-Bozzo, S., Merchant , C.J., Kent, E.C. (2017) Sea Surface Temperature Buckets, QJ, 143, 2198–2209. https://doi.org/10.1002/qj.3078.
Berry, D.I., Kent, E.C. (2017) Assessing the health of the global surface marine climate observing system, Int. J. Climatol., 37, 2248–2259. https://doi.org/10.1002/joc.4914
Carella, G., Kent, E.C., Berry, D.I. (2017) A probabilistic approach to ship voyage reconstruction in ICOADS, Int. J. Climatol., 37, 2233–2247. https://doi.org/10.1002/joc.4492
Eric Freeman, Scott D. Woodruff, Steven J. Worley, Sandra J. Lubker, Elizabeth C. Kent, William E. Angel, David I. Berry, Philip Brohan, Ryan Eastman, Lydia Gates, Wolfgang Gloeden, Zaihua Ji, Jay Lawrimore, Nick A. Rayner, Gudrun Rosenhagen, Shawn R. Smith (2016) ICOADS Release 3.0: a major update to the historical marine climate record. Int. J. Climatol., 37, 2211–2232. https://doi.org/10.1002/joc.4775
Published 2016
Morak-Bozzo, S., Merchant, C.J., Kent, E.C., Berry, D.I., Giulia Carella (2016) Climatological diurnal variability in sea surface temperature characterized from drifting buoy data. Geoscience Data Journal, 3(1), 20–28. https://doi.org/10.1002/gdj3.35
Aurélie Duchez, Eleanor Frajka-Williams, Simon A. Josey, Dafydd G. Evans, Jeremy P. Grist, Robert Marsh, Gerard D. McCarthy, Bablu Sinha, David I. Berry, Joël J.-M. Hirschi (2016) Drivers of exceptionally cold North Atlantic Ocean temperatures and their link to the 2015 European heat wave. Environmental Research Letters, 11(7), 074004. https://doi.org/10.1088/1748-9326/11/7/074004

