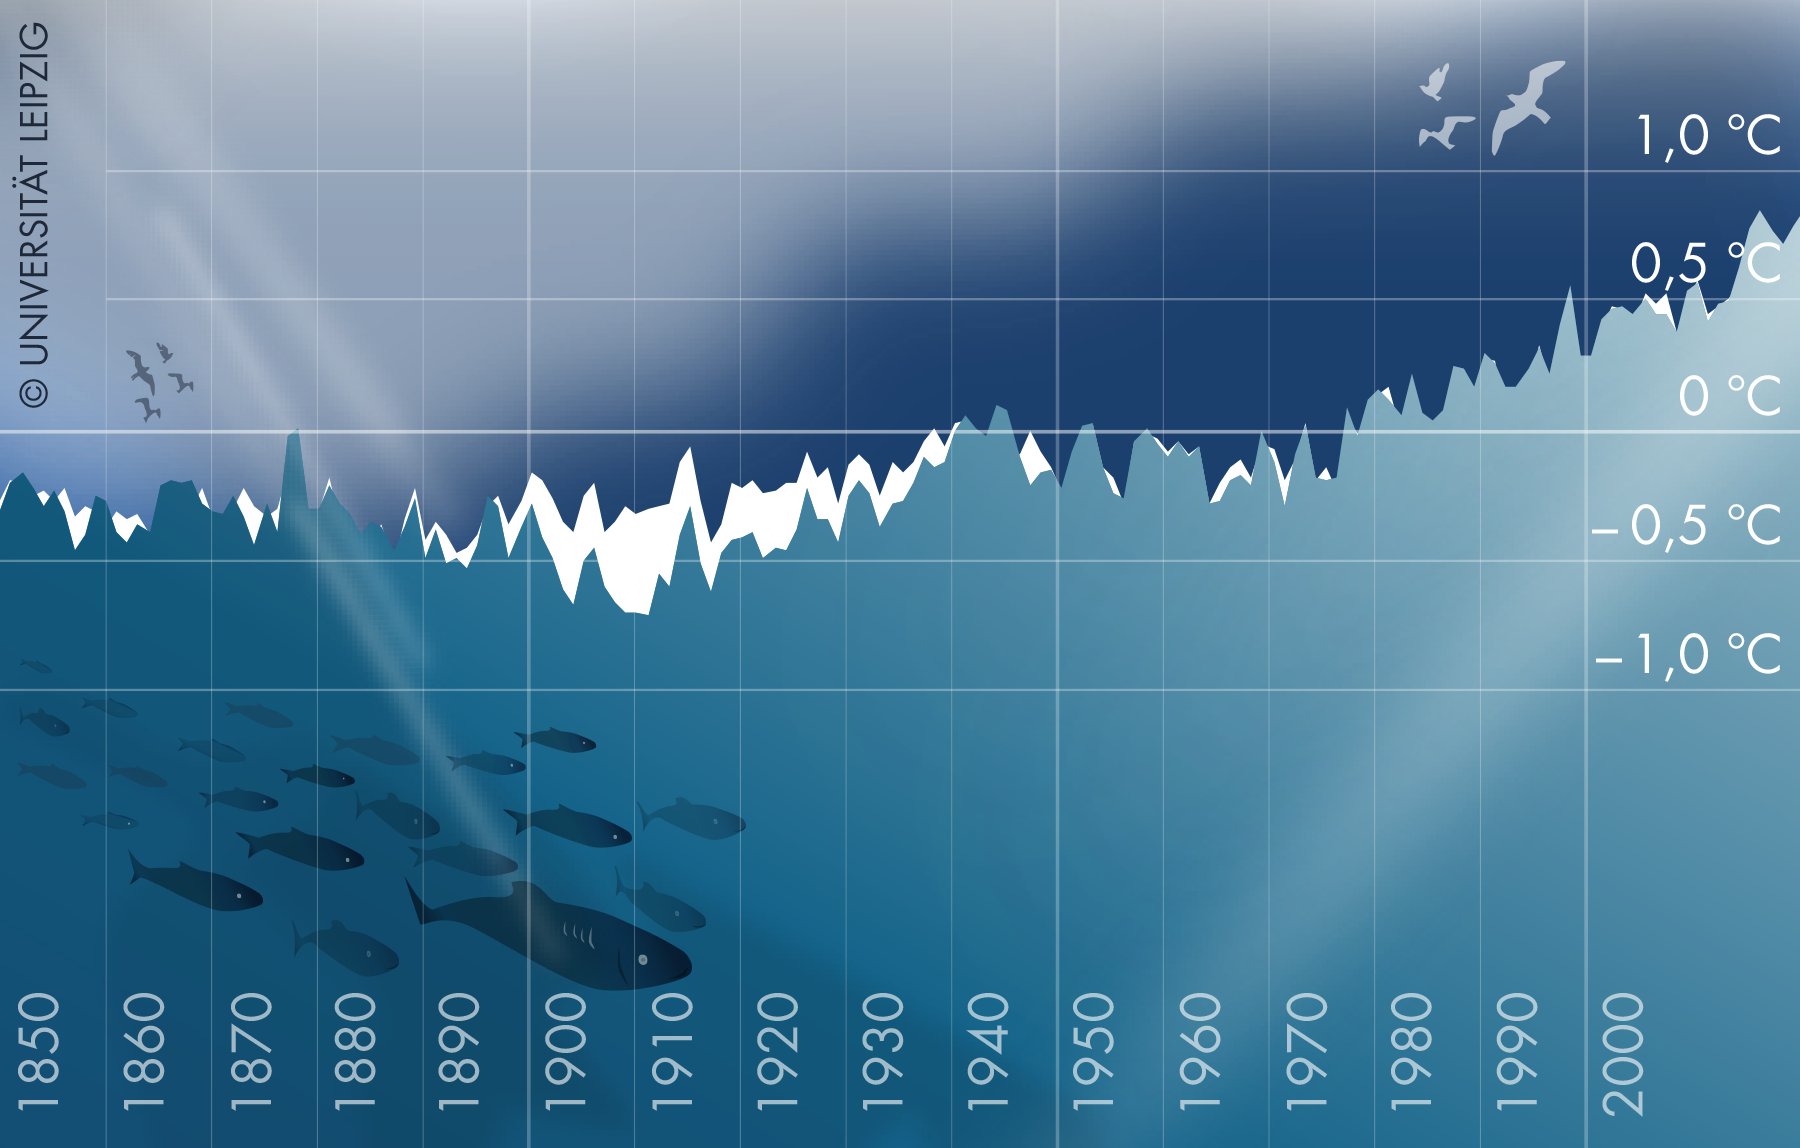
Expert knowledge of how early sea surface temperature measurements were taken has helped to explain a cold anomaly in early 20th century climate data.
The cold period, between 1900 and 1930, has puzzled scientists for decades, as the sea surface temperature measurements were much colder than temperatures measured over land and inconsistent with climate models.
Now, thanks to an analysis of the underlying raw temperature measurements by an expert at the UK’s National Oceanography Centre (NOC), a new study, led by the Leipzig University and published in Nature, has showed we now know the reason.
The cold anomaly in the data can be traced back to changes in how observers aboard ships of different nations made surface temperature measurements during this period. The results of the study have implications for our understanding of past climate variability and future climate change.
NOC’s Dr Elizabeth Kent provided in-depth knowledge about how sea surface temperature measurements were made to the study. She says, “Historical measurements of sea surface temperature were usually made with great care, but the methods used mean that measurements made in the past are not as accurate as today. In the early 20th century most measurements were of the temperature of water samples taken in canvas buckets.
“The samples cooled by evaporation during the time taken to make the measurement and the instructions on how quickly to take the measurement varied between nations and over time. Existing global surface temperature estimates contain adjustments to broadly account for the effects of changing measurement methods on the observations, but this period proved particularly challenging due to rapid changes in numbers of ships from many different nations.

“A more detailed analysis of the different data sources is needed to improve climate records and projections of future climate.”
Lead author and Junior Professor for Climate Attribution at Leipzig University Dr Sebastian Sippel stresses, “Our latest findings do not change the long-term warming since 1850. However, we can now better understand historical climate change and climate variability.
“Correcting this cold period will increase confidence in the amount of observed warming, changing what we know about historical climate variability and improve the quality of future climate models. Our new understanding confirms the climate models and shows even more clearly the human impact since pre-industrial times,” says co-author Professor Reto Knutti, Professor for Climate Physics at ETH Zurich.
Dive deeper
Read the full study.
Read Nature’s perspectives article on the study.