Research interests
As part of the Sea Level group at NOC, I research sea-level, tides and surges, seeking to understand coastal flood risk around the world. For example, I work with the UK Met Office and Environment Agency to monitor recent tide gauge data, and the performance of the operational storm surge model, using the National Tidal and Sea Level Facility. I also work closely with the Permanent Service for Mean Sea Level , whose focus is on high-quality data for long term climate studies of sea-level.
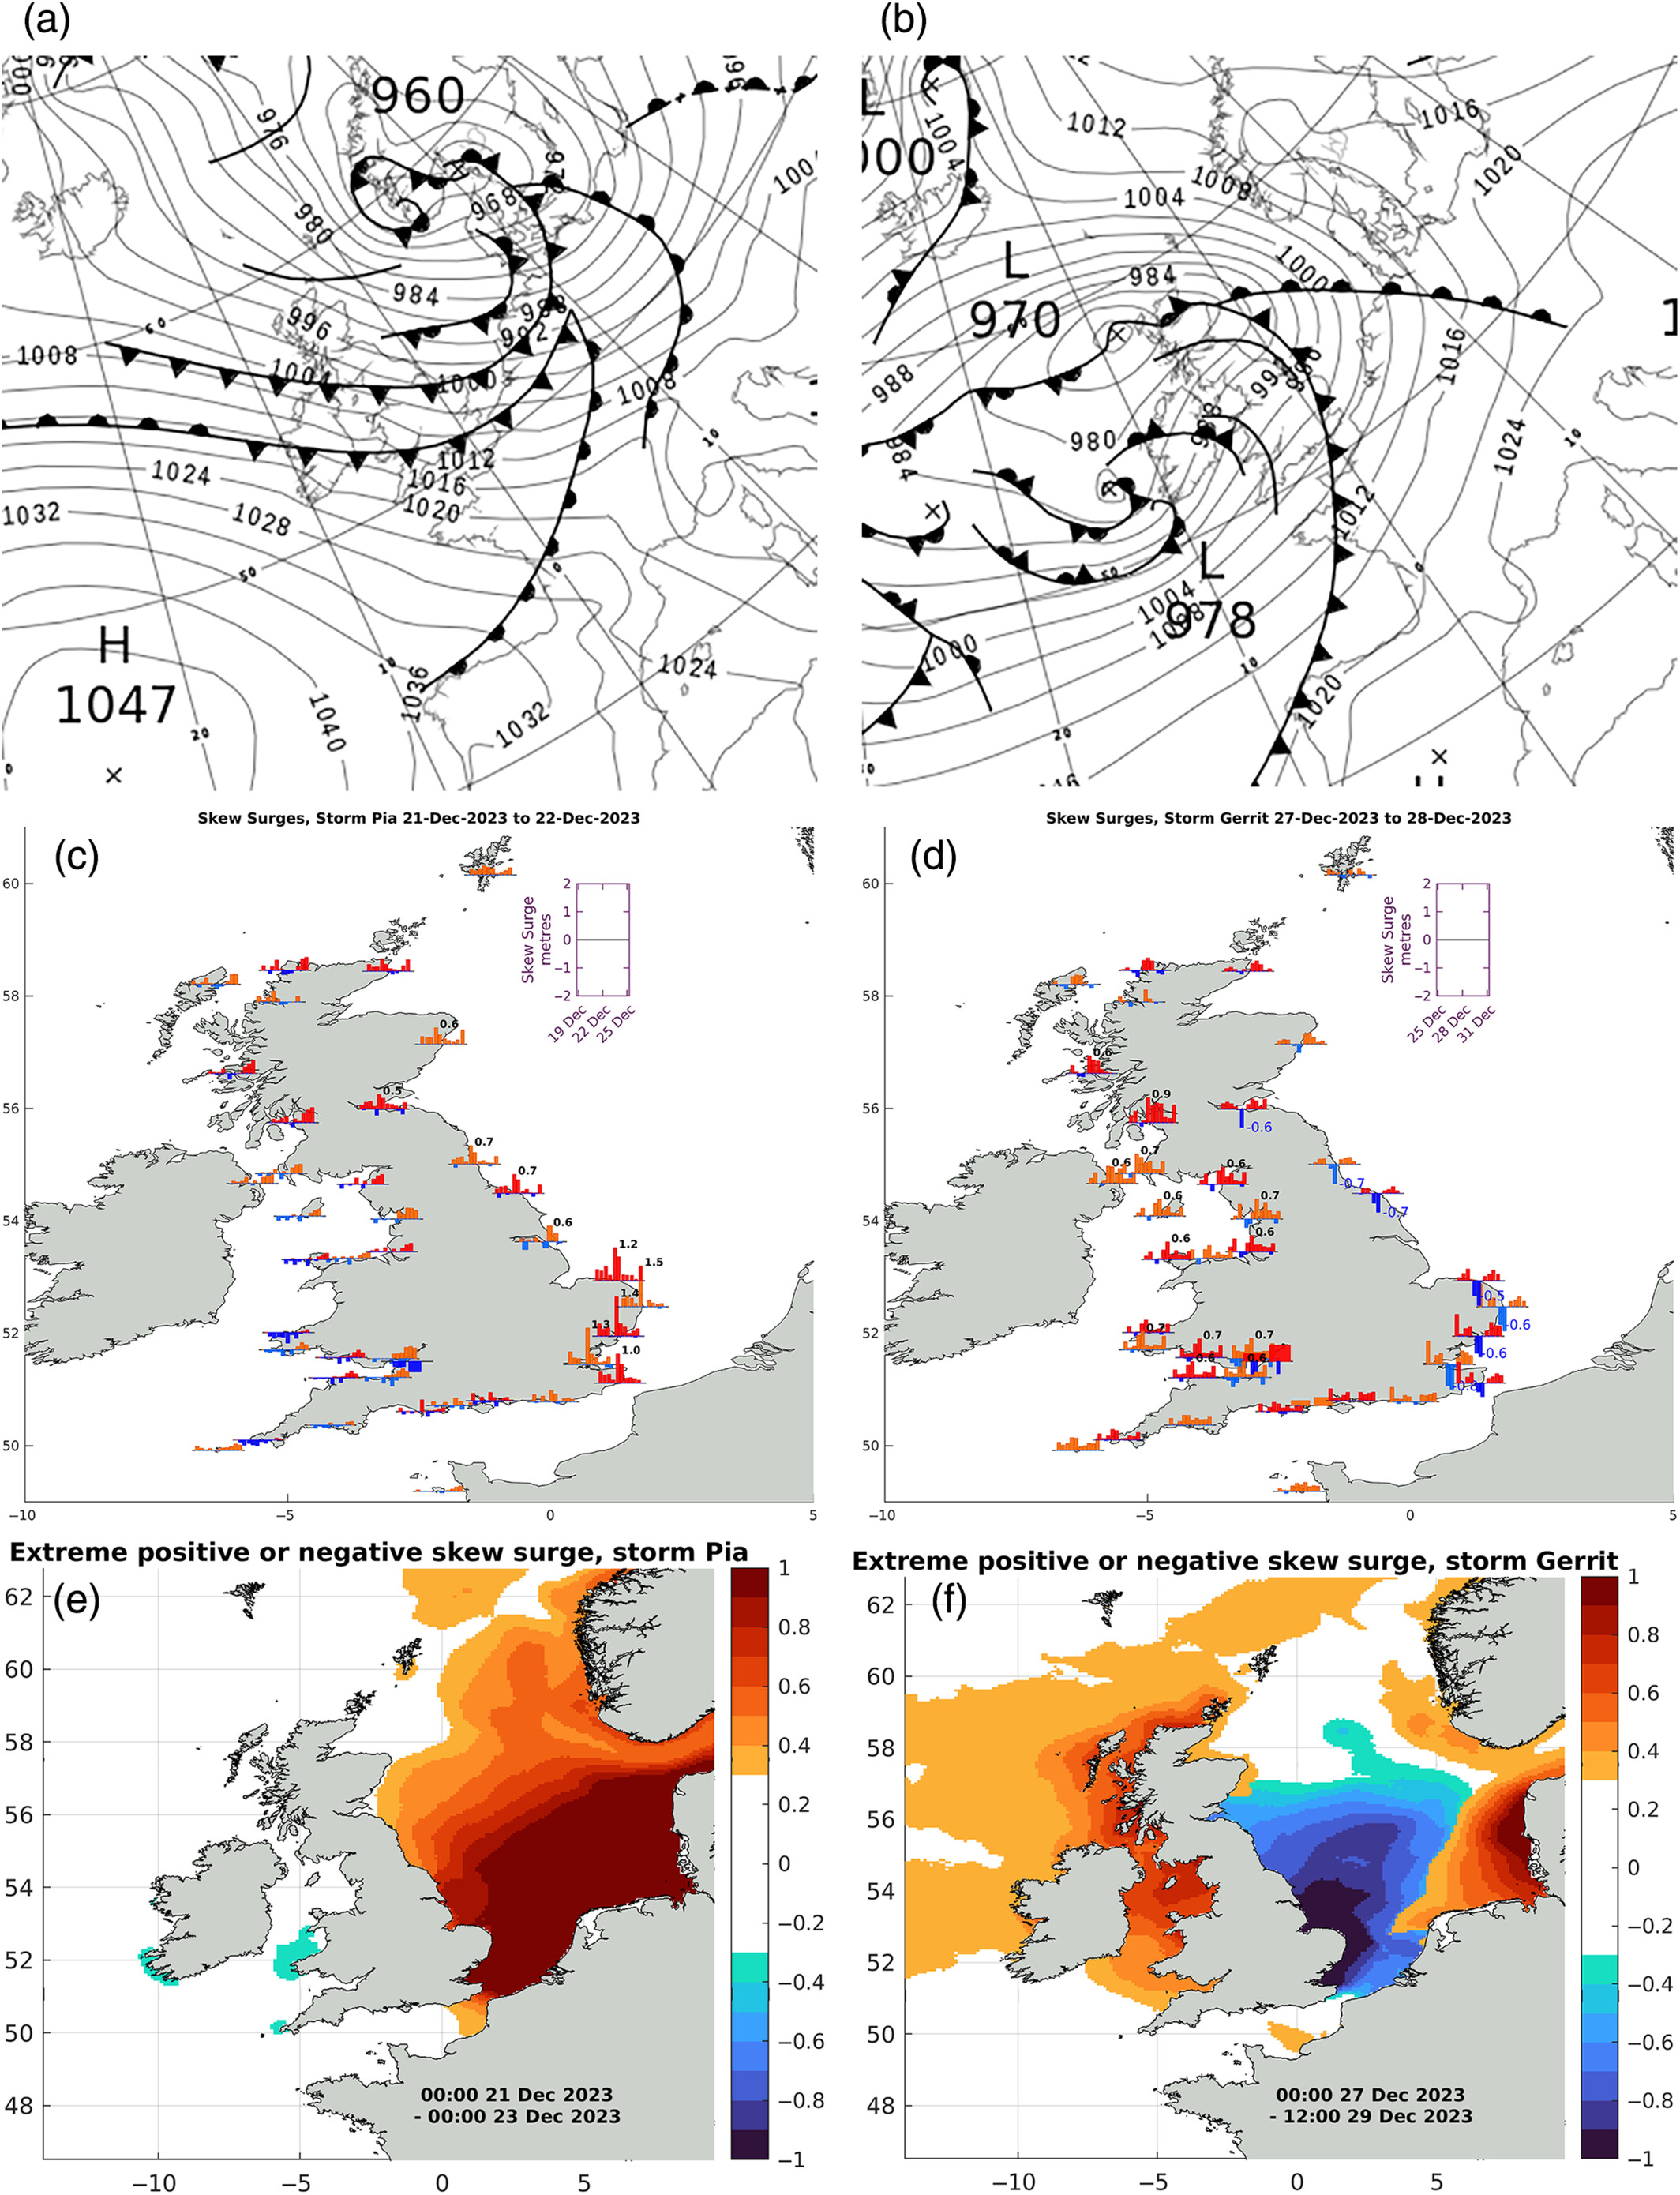
Storm surge refers to the excess sea-level that is caused by weather systems. Storm surges can be very hazardous flood events, with low air pressure and persistent winds causing the peak tide to be more than a metre higher than usual, so much further inland, and waves act on top of this. Recent UK events are summarised in the State of the UK Climate report. As the climate changes and sea-level rises, we need to estimate future risk of combined extreme weather events. For some applications we need to consider scenarios that are unlikely (low probability) but would have very severe impacts (high risk), and an example of this was this global study led by Sveta Jevrejeva. That showed that while we do expect weather patterns and storminess to change with the climate, in most places the biggest change to extreme coastal flood events will come from sea-level rise.
In the UK, where we have very large tidal range and shallow seas, one of the effects of a storm can be to change the timing of high tide as well as the maximum water level. In analysing past events from tide-gauge records we have to be very careful how we separate these effects. Rather than just take the difference between continuously measured water level and predicted tide (the non-tidal residual) we sometimes use “skew-surge”, the difference between peak observation and prediction, even if these are at a different time. This measure is less dependent on the coincidence of tide and storm, so it helps us consider what would happen if a similar storm fell in a different phase of the moon.

Tide gauges have been operated for hundreds of years, and there are still records of tides that are recorded only in hand-written books or mechanically-drawn paper charts. With help from volunteers on Zooniverse, we've digitised millions of records from Liverpool and Hilbre island on the Wirral. Once the record is post-processed and analysed it will contribute to the world-wide collection of tidal data. One use for this was in checking a model of "Storm Ulysses" from 1903, as a test of newly gathered weather data. Understanding past weather events helps us in estimating future flood risk.


In order to make easier use of tide-gauge data, I've worked on an automatic quality control system as part of the Commonwealth Marine Economies programme. I've also worked on global tide and surge reanalysis with Kevin Horsburgh on the Atlantos project.
With Chris Hughes and Mark Tamisiea I studied bottom pressure records and their use in measuring sea-level, mass changes in the ocean, and ocean circulation. Our spectral maps of bottom pressure and sea-level from ocean models are now available.

We extended the Weighing the Oceans calculation to incorporate more records and to analyse errors. You can watch some animations explaining the mass changes in the ocean.
The work on weighing the ocean has highlighted to us again that bottom pressure recorders are subject to non-linear drift, that can be at least as great as annual cycles or long-term trends. We have found that this drift can be better characterised by proper accounting of known annual cycles, and are working on techniques to improve this. You can get our code from the PSMSL website. We are also interested in alternative techniques to measure bottom pressure, such as combining thermosteric moorings and satellite altimetry.
I’m also interested in using global ocean model data, from for example the NEMO or OCCAM models, to analyse bottom pressure and sea-level where no records exist. This has led to some interesting findings about the comparison of tide-gauge records (necessarily at the shore) and altimetry (usually some distance away). We have found that whether it is valid to use these interchangeably is dependent on latitude and the time-scales of interest. More details can be found here.
Career
I have worked at the National Oceanography Centre (formerly the Proudman Oceanographic Laboratory) since 2008, mostly part-time. My PhD, in Thin-film Rimming Flows was from the University of Nottingham, with David Riley, Stephen Hibberd and Henry Power. Prior to that I was employed at Malvern in research on aircraft communication systems, and have a maths MSc from Bristol and BA from Oxford.
Researcher into sea-level, tides and storm surges.
I also serve as a Topic Editor on the subject of tides and sea-level, for the EGU open access journal Ocean Science.