
The Permanent Service for Mean Sea Level (PSMSL) has launched the latest of its interactive maps that allow users to explore changes to sea level as observed by tide gauges.
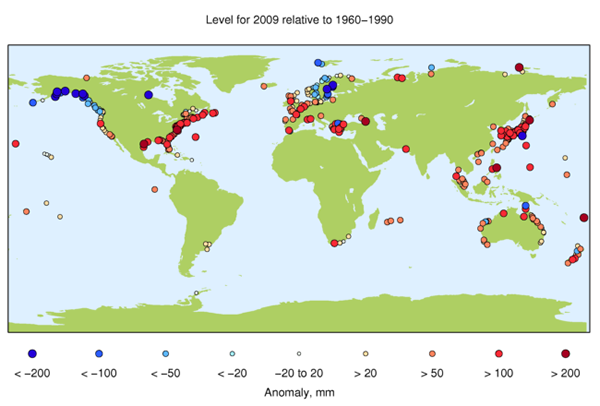
The anomalies map demonstrates how sea level varies from year to year when compared the long-term average at that site, calculated over the period from 1960 to 1990. Moving the slider along the time line shows how sea level can vary by over 20cm from year to year at some locations.
Earlier in the year, the PSMSL also introduced an interactive map for exploring the trends in the data.
When you first load the page showing the sea level anomalies, the background trend at each tide gauge is not removed. Thus, a majority of the early years are dominated by blue colours showing negative anomalies and the later years by red colours showing positive anomalies as the average global sea level rises. There are notable exceptions to this pattern, however. For example, the land surrounding the Baltic Sea is uplifting as the earth continues to recover from the collapse of the large ice sheets that covered the region during the last ice age. This causes sea level measured by tide gauges to decrease. Thus, the anomalies in that region go from red to blue over the time span of the data. To remove this background trend at each site, use the tick box below the map.
To explore the trend more thoroughly, use the trend explorer.
This map lets one see how the estimate of a constant change in time (a trend) for each of tide gauge records depends upon the period of the data used in the calculation. Zooming out to show the world, we see that the vast majority of the sites are red, indicating a sea level rise. It interesting to note the change in geographic coverage of the data over time. By choosing the entire time span, 1900–2010, you can observe the lack of data covering this period in the Southern Hemisphere and western Pacific. More data is available if the start date is moved up to 1950, but unfortunately there is still a lack of geographic coverage in the Southern Hemisphere.
Established in 1933, the PSMSL is responsible for the collection, publication, analysis and interpretation of sea level data from the global network of tide gauges. It is based in Liverpool at the National Oceanography Centre, which is a component of the UK Natural Environment Research Council.